
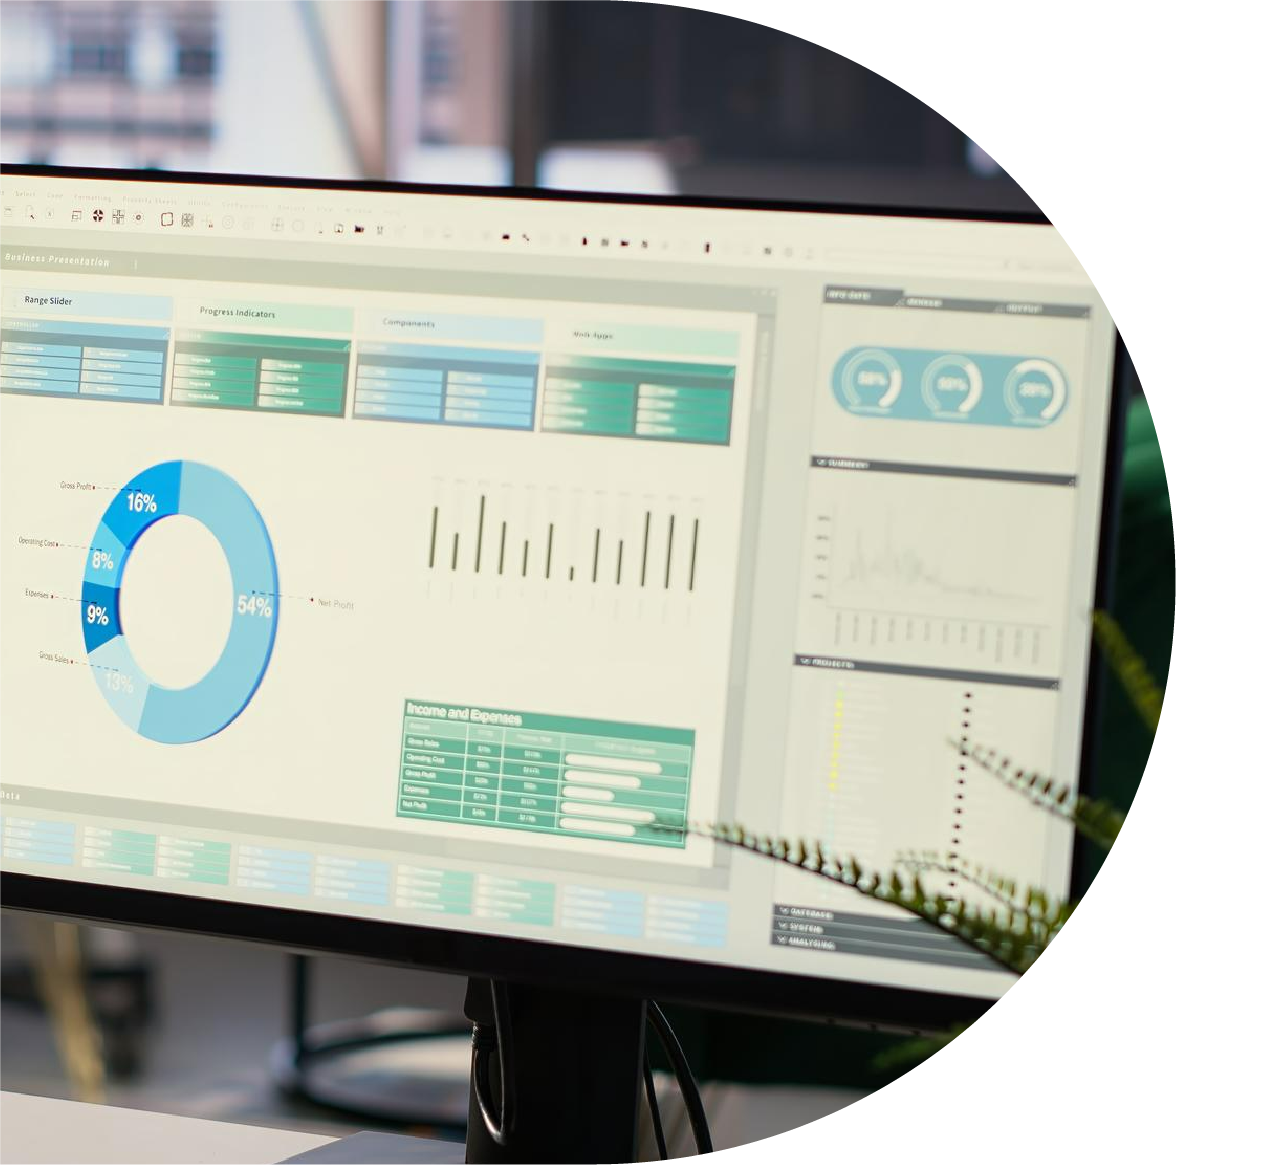
Reporting Dashboards
OMI’s Reporting Dashboards are designed to help operations professionals visualize, track, and communicate key performance data with clarity and precision. These dashboards transform complex metrics into actionable insights—supporting better decisions, faster responses, and stronger operational control.